1. Introduction
이미지 분석에서 Multi class를 나누는 모델을 제작하고 하면 무조건 해야하는 것 중 하나가 성능검증입니다.
성능검증에는 흔하게 사용되는 방법이 바로 Specificity, Sensitivity, Precision 입니다.
Sensitivity의 경우 다른 말로 recall, True positive rate, hit rate라고 불리며, Specificity는 True negative rate이고, Precision의 경우 Positive predictive rate입니다.
그리고 최근 많이 사용하기 시작한 것이 F1 Score입니다. 각 식의 경우 위키디피아에 요약이 되어있으니 확인해보시길 바랍니다.
2. Sensitivity, Specificity, F1 Score구하기
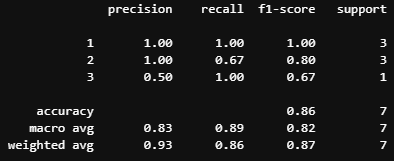
Sensitivity와 precision, F1 score는 손쉽게 sklearn을 이용하여 구할 수가 있습니다.
from sklearn.metrics import classification_report
label=[1,2,1,2,3,2,1]
pred=[1,2,1,3,3,2,1]
print(classification_report(label,pred))
그렇다면 Specificity는 어떻게 구해야 할까요? 먼저 우리가 위 데이터에서 고려해야할 class는 총 3개입니다.
coufusion matrix를 한번 그려보겠습니다. 이것도 sklearn에 기능이 있습니다.
from sklearn.metrics import confusion_matrix
label=[1,2,1,2,3,2,1]
pred=[1,2,1,3,3,2,1]
print(confusion_matrix(label,pred))

# output
[[3 0 0]
 [0 2 1]
 [0 0 1]]

위와 같은 Multi class에서 TN, TP, FP, FN을 어떻게 생각해야되는지 그림을 통해 그려보았습니다.
3X3뿐만 아니라 그 이상일 경우에도 적용이 가능합니다(아래 참조).

그렇다면 Specificity를 어떻게 계산을 해야할까요? confusion matrix만 제작한다면 쉽게 계산이 가능합니다.
import numpy as np
import pandas as pd
from sklearn.metrics import confusion_matrix
cfx = confusion_matrix(y,y_pred)
FP = cfx.sum(axis=0) - np.diag(cfx)
FN = cfx.sum(axis=0) - np.diag(cfx)
TP = np.diag(cfx)
TN = cfx.sum() - (FP + FN +TP)
spec = pd.DataFrame( [(lambda x: TP[x]/(TP[x] + FN[x]))(range(cfx.shape[0])),
                     (lambda x: TN[x]/(TN[x] + FP[x]))(range(cfx.shape[0])),
                     (lambda x: TP[x]/(TP[x] + FP[x]))(range(cfx.shape[0])),
                     (lambda x: TN[x]/(TN[x] + FN[x]))(range(cfx.shape[0])),
                     (lambda x: (2*TP[x])/(2*TP[x] + FP[x] +FN[x]))(range(cfx.shape[0])) ],
                     columns = list(range(cfx.shape[0])),index = ['Sensitivity (recall)','Specificity',
                                 'Precision (Positive predictive rate)',
                                 'Negative predictive rate','F1 Score'])
람다를 이용하면 손쉽게 구할 수가 있습니다.
그리고 def로 제작되었기 때문에 NaN이 나올 수가 있습니다.
from sklearn.metrics import confusion_matrix
label=[1,2,1,2,3,2,4,2,3,4,1]
pred=[1,2,1,3,3,2,1,1,2,2,3]
print(confusion_matrix(label,pred))

# output
[[2 0 1 0]
 [1 2 1 0]
 [0 1 1 0]
 [1 1 0 0]]
위와 같은 경우에는 NaN이 나옵니다. TP, FP가 0인 경우가 있기 때문에 NaN이 나옵니다.

여기까지 이미지 모델의 성능검증에서 Specificity, Senesitivity(recall), precision, F1 score를 구하는 방법에 대해서 알아보았습니다.
감사합니다.
'딥러닝\머신러닝 > 이미지분석' 카테고리의 다른 글
| [cv2] 색감을 보는 방법 (RGB, BGR, HSV, LAB) (0) | 2023.01.19 |
|---|---|
| [pytorch, 이미지분석] 이미지 불러올 때, io.imread, plt.imread 차이 (0) | 2022.08.04 |
| [pytorch] 이미지 분석에 필요한 GPU 메모리 정도를 확인해보기 (0) | 2022.07.05 |
| [image분석] 의료이미지데이터 분석 준비 (0) | 2022.03.21 |
| [image분석] openslide module 설치에서 에러 해결 (0) | 2021.12.16 |


댓글