이번 포스팅은 barplot과 histogram에 대해 그려보도록 하겠습니다
barplot, histogram은 비슷하게 생겼지만 완전 다른 데이터를 나타나게 됩니다.
barplot의 경우 불연속적인 데이터를 나타날때 사용이 되고,
histogram의 경우 연속적인 데이터에 대한 빈도수를 나타낼때 사용됩니다.
예시로 한 학급에 대해 시험점수를 통계를 낼때,
histogram의 경우 점수의 분포를 알기 위해서 사용할 수가 있고,
barplot의 경우 학생당 과목마다의 점수가 얼마나 나오는지 확인할때 사용할 수가 있습니다.
아래 설명에는 ggplot2 package에 포함된 diamonds dataset을 이용하였습니다.
1. barplot
가장 먼저 알려드릴 내용은 barplot입니다. barplot은 histogram과는 다르게 각 데이터마다 고유의 값을 가지고 있어야합니다.
예를들어 cut 별로 가격차이를 확인해보고 싶을 경우 cut별로 평균값들을 계산후에 barplot을 만들수가 있습니다.
barplot의 기본 코드는 다음과 같습니다.
library(ggplot2)
dia2<-data.frame(cut=diamonds$cut,price=diamonds$price)
data1<-data.frame(cut=c('Fair','Good','Very Good','Premium','Ideal'),
                  price=c(mean(dia2[dia2$cut=='Fair','price']),
                          mean(dia2[dia2$cut=='Good','price']),
                          mean(dia2[dia2$cut=='Very Good','price']),
                          mean(dia2[dia2$cut=='Premium','price']),
                          mean(dia2[dia2$cut=='Ideal','price'])))

p1<-ggplot(data=data1)+geom_bar(aes(x=cut,y=price),stat = 'identity')
p2<-ggplot(data=data1)+geom_bar(aes(x=cut,y=price),stat = 'identity')+coord_flip()
# p2 == ggplot(data=data1)+geom_bar(aes(y=cut,x=price),stat = 'identity')
p3<-ggplot(data=data1)+geom_bar(aes(x=cut,y=price),stat = 'identity')+coord_polar()
p4<-ggplot(data=data1)+geom_bar(aes(x=cut,y=price,fill=cut),stat = 'identity')
library(gridExtra)
grid.arrange(p1,p2,p3,p4,ncol=2)

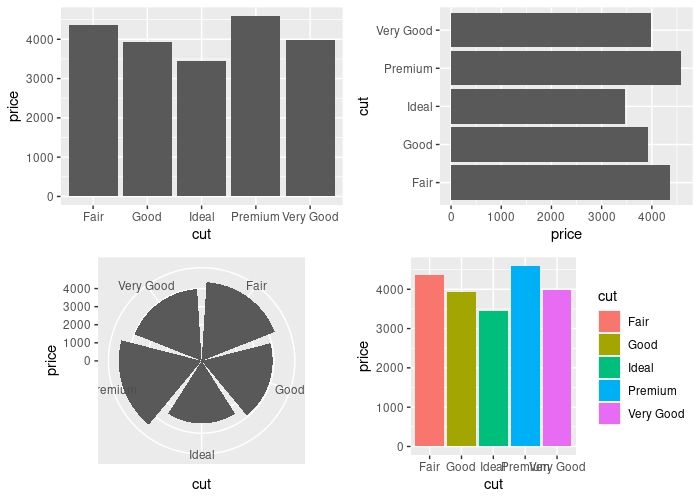
data1의 경우 diamonds dataset에서 데이터를 뽑아내서 만든 데이터입니다.
p1 의 경우 기본적인 barplot이고,
p2의 경우 90도로 꺽은 barplot입니다.
p3의 경우는 동그란모양으로 만든 barplot이고 (ggplot2에서 pie chart를 만들때도 이런 방식으로 할겁니다.)
p4의 경우 색을 추가한 barplot입니다.
'+'로 되어있는 function은 대부분 다른 plot에서도 구현이 가능합니다.
barchart를 표현할때 색을 변경과 bar의 크기 변경에는 다음과 같이 변경할 수 있습니다.
p1<-ggplot(data=data1)+geom_bar(aes(x=cut,y=price,fill=cut),stat = 'identity')
p2<-ggplot(data=data1)+geom_bar(aes(x=cut,y=price,fill=cut),stat = 'identity')+scale_fill_brewer(palette='Dark2')
p3<-ggplot(data=data1)+geom_bar(aes(x=cut,y=price,fill=cut),stat = 'identity')+scale_fill_manual(values = c('red','orange','brown','yellow','blue'))
p4<-ggplot(data=data1)+geom_bar(aes(x=cut,y=price,fill=cut),stat = 'identity')+scale_fill_grey()
p5<-ggplot(data=data1)+geom_bar(aes(x=cut,y=price,fill=cut),color='red',stat = 'identity')+scale_fill_grey()
p6<-ggplot(data=data1)+geom_bar(aes(x=cut,y=price,fill=cut),stat = 'identity')+scale_x_discrete(limits=c('Good','Ideal'))
p7<-ggplot(data=data1)+geom_bar(aes(x=cut,y=price,fill=cut),stat = 'identity',width = .5)+scale_x_discrete(limits=c('Good','Ideal'))
grid.arrange(p1,p2,p3,p4,p5,p6,p7,ncol=3)

1번의 경우 기본적인 색변경이고,
2,3,4번의 경우 다른 plot에서 적용가능한 삼총사를 이용하여 색을 변경한 것입니다.
scale_fill_brewer의 경우 RColorBrewer를 참고(구글검색!)하시면 색 세트를 선택할 수가 있습니다.
scale_fill_manual의 경우 각 bar마다 값을 지정할수가 있습니다.
5번의 경우 겉 테두리에 색을 지정이 가능합니다.
6번의 경우 특정 값들을 가져와서 그릴수가 있습니다. (warning이 발생할수있지만 무시해도 됩니다.)
scale_x_discrete의 경우 순서를 변경할때도 이용합니다. (scale_y_discrete의 경우 어떤 기능을 하는지 유추가 가능하죠?)
7번의 경우 bar의 크기를 조절이 가능합니다.
barplot을 그릴때 group에 따라 보고싶을때가 있는데 다음과 같이 표현이 가능합니다.
# data1의 경우 임의로 diamonds data를 이용하여 만들었습니다.
data1<-data.frame(cut=c('Fair','Good','Very Good','Premium','Ideal','Fair','Good','Very Good','Premium','Ideal'),
                  group=c(rep('A',5),rep('B',5)),
                  price=c(mean(dia2[dia2$cut=='Fair','price']),
                          mean(dia2[dia2$cut=='Good','price']),
                          mean(dia2[dia2$cut=='Very Good','price']),
                          mean(dia2[dia2$cut=='Premium','price']),
                          mean(dia2[dia2$cut=='Ideal','price']),
                          mean(dia2[dia2$cut=='Fair','price']),
                          mean(dia2[dia2$cut=='Very Good','price']),
                          mean(dia2[dia2$cut=='Premium','price']),
                          mean(dia2[dia2$cut=='Good','price']),
                          mean(dia2[dia2$cut=='Ideal','price'])
                          ))


p1<-ggplot(data=data1)+geom_bar(aes(x=cut,y=price,fill=group),stat='identity')
p2<-ggplot(data=data1)+geom_bar(aes(x=cut,y=price,fill=group),stat='identity',position = position_stack())
p3<-ggplot(data=data1)+geom_bar(aes(x=cut,y=price,fill=group),stat='identity',position = position_dodge2())
p4<-ggplot(data=data1)+geom_bar(aes(x=cut,y=price,fill=group),stat='identity',position = position_dodge())
p5<-ggplot(data=data1)+geom_bar(aes(x=cut,y=price,fill=group),stat='identity',position = position_fill())
grid.arrange(p1,p2,p3,p4,p5,ncol=3)

#아래는 같은 그래프를 다르게 표현한것 입니다.

p1<-ggplot(data=data1)+geom_bar(aes(x=cut,y=price,fill=group),stat='identity')
p2<-ggplot(data=data1)+geom_bar(aes(x=cut,y=price,fill=group),stat='identity',position = 'stack')
p3<-ggplot(data=data1)+geom_bar(aes(x=cut,y=price,fill=group),stat='identity',position =  'dodge2')
p4<-ggplot(data=data1)+geom_bar(aes(x=cut,y=price,fill=group),stat='identity',position = 'dodge')
p5<-ggplot(data=data1)+geom_bar(aes(x=cut,y=price,fill=group),stat='identity',position = 'fill')

1, 2번의 경우 기본적으로 나타낼수있는 경우이고,
3, 4번의 경우 position_dodge(), position_dodge2()의 차이는 width의 차이입니다.
5번의 경우 가끔 microbiome분석시에 저런 형식으로 나타낼때가 있습니다.(표준화시킨후에 표현)
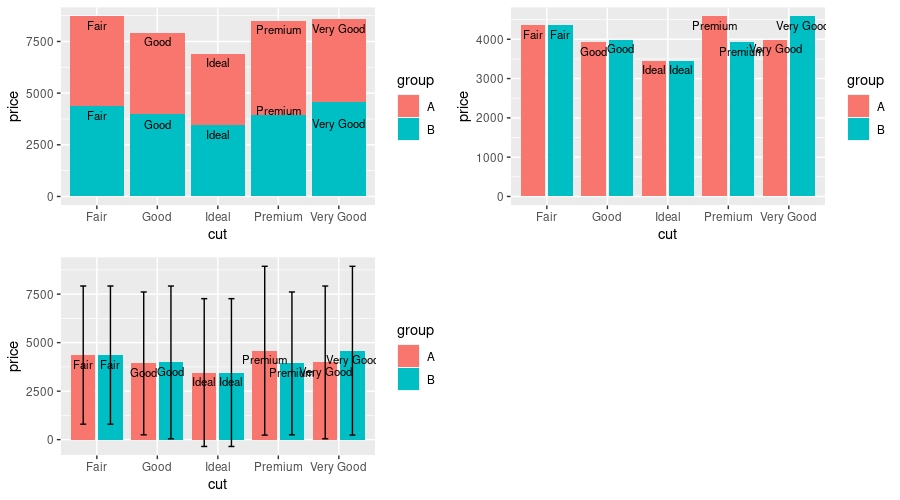
마지막으로 각 bar에다가 text나 숫자표시 혹은 errorbar를 추가하고 싶을 경우 다음과 같이 하면 됩니다.
data1<-data.frame(cut=c('Fair','Good','Very Good','Premium','Ideal','Fair','Good','Very Good','Premium','Ideal'),
                  group=c(rep('A',5),rep('B',5)),
                  price=c(mean(dia2[dia2$cut=='Fair','price']),
                          mean(dia2[dia2$cut=='Good','price']),
                          mean(dia2[dia2$cut=='Very Good','price']),
                          mean(dia2[dia2$cut=='Premium','price']),
                          mean(dia2[dia2$cut=='Ideal','price']),
                          mean(dia2[dia2$cut=='Fair','price']),
                          mean(dia2[dia2$cut=='Very Good','price']),
                          mean(dia2[dia2$cut=='Premium','price']),
                          mean(dia2[dia2$cut=='Good','price']),
                          mean(dia2[dia2$cut=='Ideal','price']) ),
                  sd=c(sd(dia2[dia2$cut=='Fair','price']),
                       sd(dia2[dia2$cut=='Good','price']),
                       sd(dia2[dia2$cut=='Very Good','price']),
                       sd(dia2[dia2$cut=='Premium','price']),
                       sd(dia2[dia2$cut=='Ideal','price']),
                       sd(dia2[dia2$cut=='Fair','price']),
                       sd(dia2[dia2$cut=='Very Good','price']),
                       sd(dia2[dia2$cut=='Premium','price']),
                       sd(dia2[dia2$cut=='Good','price']),
                       sd(dia2[dia2$cut=='Ideal','price']) ),
                  label_y=c(mean(dia2[dia2$cut=='Fair','price']),
                            mean(dia2[dia2$cut=='Good','price']),
                            mean(dia2[dia2$cut=='Very Good','price']),
                            mean(dia2[dia2$cut=='Premium','price']),
                            mean(dia2[dia2$cut=='Ideal','price']),
                            mean(dia2[dia2$cut=='Fair','price'])+mean(dia2[dia2$cut=='Fair','price']),
                            mean(dia2[dia2$cut=='Very Good','price'])+mean(dia2[dia2$cut=='Good','price']),
                            mean(dia2[dia2$cut=='Premium','price'])+mean(dia2[dia2$cut=='Very Good','price']),
                            mean(dia2[dia2$cut=='Good','price'])+mean(dia2[dia2$cut=='Premium','price']),
                            mean(dia2[dia2$cut=='Ideal','price'])+mean(dia2[dia2$cut=='Ideal','price']) )
)

p1<-ggplot(data=data1)+geom_bar(aes(x=cut,y=price,fill=group),stat='identity')+geom_text(aes(x=cut,y=label_y,label=cut),vjust=1.5,size=3,position = position_dodge(0.9))
p2<-ggplot(data=data1,aes(x=cut,y=price,fill=group))+geom_bar(stat='identity',position =  'dodge2')+geom_text(aes(label=cut),vjust=1.5,size=3,position = position_dodge(0.9))
p3<-ggplot(data=data1,aes(x=cut,y=price,fill=group))+geom_bar(stat='identity',position =  'dodge2')+
  geom_text(aes(label=cut),vjust=1.5,size=3,position = position_dodge(0.9))+
  geom_errorbar(aes(ymin=price-sd,ymax=price+sd),width=.2,position = position_dodge(.9))

grid.arrange(p1,p2,p3,ncol=2)

글자나 숫자를 추가할경우 추가할 label의 y값을 미리 계산하셔야하고, geom이 여러개 들어갈 경우 aes는 ggplot에 넣어주는것이 좋습니다.
geom마다 aes를 원하기 때문에 한꺼번에 적용을 하기 위해서는 ggplot에 추가하시고 geom마다 추가되는 aes를 넣어주시면 됩니다.
errorbar 또한 값을 구해놓은 다음 분석이 이루어져야 합니다. (위에서는 mean값과 sd값을 이용하여 plot을 그렸습니다.)
2. histogram
histogram의 경우 barplot과는 다르게 preprocessing 없이 바로 만들 수가 있습니다.
p1<-ggplot(diamonds,aes(x=carat))+geom_histogram()
p2<-ggplot(diamonds,aes(x=carat))+geom_histogram(color='red')
p3<-ggplot(diamonds,aes(x=carat,color=color))+geom_histogram(position = 'identity')
p4<-ggplot(diamonds,aes(x=carat))+geom_histogram(aes(y=..density..,color='red',position = 'fill'))+geom_density()
p5<-ggplot(diamonds,aes(x=carat,color=color))+geom_histogram(aes(y=..density..),position = 'identity')+geom_density()
p6<-ggplot(diamonds,aes(x=carat,fill=color))+geom_histogram(position = 'identity')
p7<-ggplot(diamonds,aes(x=carat,fill=color))+geom_histogram(position = 'identity',alpha=0.5)
p8<-ggplot(diamonds,aes(x=carat,fill=color))+geom_histogram(aes(y=..density..),position = 'identity')+geom_density(alpha=.1)

grid.arrange(p1,p2,p3,p4,p5,p6,p7,p8,ncol=3)
1번의 경우 기본적인 histogram이고,
2번의 경우 기본적인 histogram에서 경계선을 추가한 경우입니다.
3번의 경우 여러가지 데이터의 histogram을 추가한 경우이고, (color말고 fill로 변경하면 6번과 같은 그림이 나옵니다.)
4번의 경우 density plot으로 변경이 가능하고, 5번처럼 여러개에 적용이 가능합니다.
7번 8번 처럼 alpha값을 추가함으로서 겹치는 부분은 선명하게 표현이 가능합니다.
histogram의 경우 간단하게 보여만 드리는 것(어차피 barplot적용되는 기능이 histogram에서도 적용이 가능합니다.)이고, 추가로 궁금하시면 댓글남겨주시고, 제가 새로운 표현방법들을 알게되면 자료 추가 하도록 하겠습니다.
감사합니다.
'실용적인프로그래밍 > R' 카테고리의 다른 글
| [R] pheatmap에 오류발생 (NA/NaN/Inf in foreign function call) (5) | 2021.04.19 |
|---|---|
| [R] pheatmap으로 예쁜 heatmap 그리기 (6) | 2021.01.29 |
| [R] ggplot package boxplot 그리기 (0) | 2021.01.13 |
| [R][Shiny] shiny 앱 실행시 발생하는 에러 해결! (0) | 2020.12.18 |
| [R] 차원축소 PCA, PCoA (MDS) 실습 데이터 유사도! (0) | 2020.12.05 |


댓글