분석에서 사용되는 plot중에 pairplot이 있습니다.
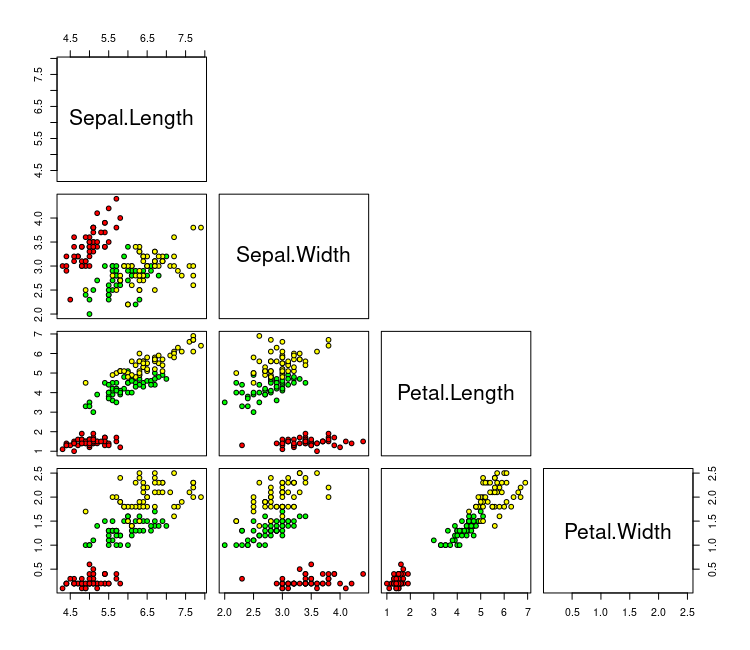
기본적인 R에서는 pairs라는 기능을 이용하면 쉽게 만들수가 있지만, ggplot에서는 손수 만들어줘야하는 불편함이 있습니다. (정정하겠습니다. ggplot에는 plotmatrix, ggpairs등이 있는 것을 확인하였습니다.)
불편하지만, 그만큼 커스텀이 가능하다는 장점도 있습니다.
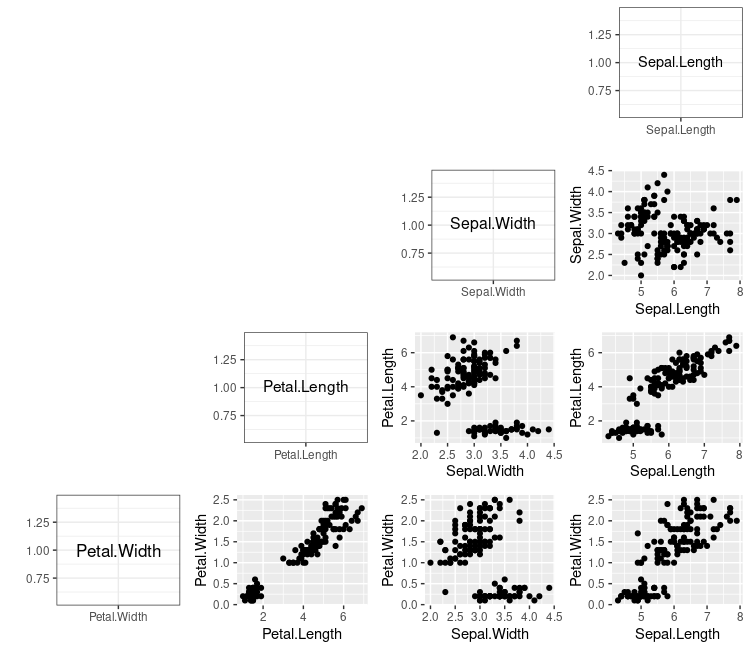
ggplot을 이용하여 간단한 pairplot을 그려보면 다음과 같이 그릴 수 있습니다.
library(ggplot2)
library(gridExtra)
library(ggfittext)
data("iris")
# pair plot

test<-data.frame(test='Sepal.Length',size=1000)
text<-ggplot(test,aes(x=test,y=1,label=test))+geom_fit_text(grow=T)+theme_bw()+ xlab('')+ylab('')

test<-data.frame(test='Sepal.Width',size=1000)
text1<-ggplot(test,aes(x=test,y=1,label=test))+geom_fit_text(grow=T)+theme_bw()+xlab('')+ylab('')

test<-data.frame(test='Petal.Length',size=1000)
text2<-ggplot(test,aes(x=test,y=1,label=test))+geom_fit_text(grow=T)+theme_bw()+xlab('')+ylab('')

test<-data.frame(test='Petal.Width',size=1000)
text3<-ggplot(test,aes(x=test,y=1,label=test))+geom_fit_text(grow=T)+theme_bw()+xlab('')+ylab('')

p1=ggplot(data=iris)+aes(x=Sepal.Length,y=Sepal.Width)+geom_point()
p2=ggplot(data=iris)+aes(x=Sepal.Length,y=Petal.Length)+geom_point()
p3=ggplot(data=iris)+aes(x=Sepal.Length,y=Petal.Width)+geom_point()
p4=ggplot(data=iris)+aes(x=Sepal.Width,y=Petal.Length)+geom_point()
p5=ggplot(data=iris)+aes(x=Sepal.Width,y=Petal.Width)+geom_point()
p6=ggplot(data=iris)+aes(x=Petal.Length,y=Petal.Width)+geom_point()

plot_mat=rbind(c(NA,NA,NA,1),
               c(NA,NA,2,3),
               c(NA,4,5,6),
               c(7,8,9,10))
grid.arrange(text, # 1= text
             text1,p1, # 2=text1, 3=p1
             text2,p4,p2, # 4=text2, 5=p4, 6=p2
             text3,p6,p5,p3, # 7=text3,8=p6, 9=p5 10=p3
             layout_matrix=plot_mat)
여기서 첫 등장하는 ggfittext라는 package는 간단히 말해 plot에다가 글자그림을 추가해주는 부가기능을 갖습니다.
gridExtra package는 여러 그림들을 하나의 plot으로 그려주는 기능을 갖습니다.

다음과 같이 나오는데 뭔가 마음에 안드는 부분이 몇 있다. 기본적인 R에서 pairs결과 보다 뭔가 허접해보인다.
(괜찮다고 생각하지말자, 좀 더 예쁘게 그려야 보는사람도 기분이 좋다)
levels(iris$Species)=c(1,2,3)
pairs(iris[,c(1:4)],upper.panel = NULL,bg=c('red','green','yellow')[iris$Species],pch=21)

그림 하나에 대해서 수정을 해보겠습니다.
변수이름에 대한 수정으로
1. 내부의 격자를 없애야 한다. -> panel.grid.major, panel.grid.minor
2. 눈금도 없애야 한다. -> axis.ticks.x, axis.ticks.y
3. 전체적인 크기를 조절할 수 있으면 해야한다.
-> axis.text.x= element_text(size=0), axis.text.y= element_text(size=0)
4. x,y축의 이름을 제거해야 한다.
-> xlab(''), ylab('')
test<-data.frame(test='Sepal.Length',size=1000)
text<-ggplot(test,aes(x=test,y=1,label=test))+geom_fit_text(grow=T)+theme_bw()+ xlab('')+ylab('')

test<-data.frame(test='Sepal.Length',size=1000)
text1<-ggplot(test,aes(x=test,y=1,label=test))+theme_bw()+ xlab('')+ylab('') + xlab('')+ylab('')+geom_fit_text(grow=T)+
  theme(panel.grid.major = element_blank(),
        panel.grid.minor = element_blank(),
        axis.ticks.y = element_blank(),
        axis.ticks.x = element_blank())+
  theme(axis.text.x = element_text(colour = 'white',size = 0),
        axis.text.y = element_text(colour = 'white',size = 0))


grid.arrange(text,text1)

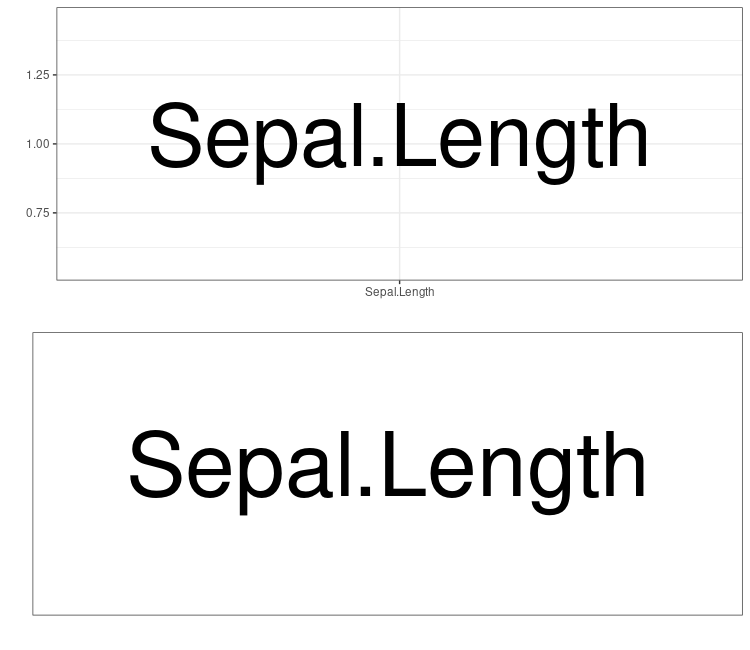
다음과 같이 변환을 시켰고, 각 scatter plot마다 변화를 줘야한다.
plot layout 기준
| NA | NA | NA | (1번 plot) 수정완료 |
| NA | NA | (2번 plot) 수정완료 |
(3번 plot) xlab 제거 y축 오른쪽 변경 |
| NA | (4번 plot) 수정완료 |
(5번 plot) xlab,ylab 제거 x,y눈금제거 |
(6번 plot) xlab 제거 y축 오른쪽 변경 |
| (7번 plot) 수정완료 |
(8번 plot) ylab 제거 y눈금 제거 |
(9번 plot) ylab 제거 y눈금 제거 |
(10번 plot) y축 오른쪽 변경 |
간단하게 예시로 5번 plot과 6번 plot을 고쳐보도록 하겠습니다.
5번 plot 변경
p4=ggplot(data=iris)+aes(x=Sepal.Width,y=Petal.Length,col=Species)+geom_point()

p4_1=ggplot(data=iris)+aes(x=Sepal.Width,y=Petal.Length,col=Species)+geom_point()+
  theme_bw()+theme(legend.position = 'none')+
  ylab('')+xlab('')+
  theme(axis.text.y = element_blank(),axis.ticks.y = element_blank(),
        axis.text.x = element_blank(),axis.ticks.x = element_blank())

grid.arrange(p4,p4_1)
theme_bw() = 회색배경을 흰색으로 변경
theme(legend.position='none') = 색에 대한 정보를 갖는 legend 제거
xlab(''),ylab('') = x,y축 이름 제거
theme(axis.text.y=element_blank(),axis.ticks.y=element_blank()) = y눈금 제거
theme(axis.text.x=element_blank(),axis.ticks.x=element_blank()) = x눈금 제거
6번 plot 변경
p2=ggplot(data=iris)+aes(x=Sepal.Length,y=Petal.Length,col=Species)+geom_point()

p2_1=ggplot(data=iris)+aes(x=Sepal.Length,y=Petal.Length,col=Species)+geom_point()+
  theme_bw()+theme(legend.position = 'none')+
  xlab('')+
  theme(axis.ticks.x = element_blank(),axis.text.x = element_blank())+
  scale_y_continuous(position = 'right')

grid.arrange(p2,p2_1)
scale_y_continuous(position = 'right') = y 축을 오른쪽으로 변경
위 내용을 적용해보면 다음과 같습니다.
library(ggplot2)
library(gridExtra)
library(ggfittext)
data("iris")
# pair plot

test<-data.frame(test='Sepal.Length',size=1000)
text<-ggplot(test,aes(x=test,y=1,label=test))+theme_bw()+ xlab('')+ylab('') + xlab('')+ylab('')+geom_fit_text(grow=T)+
  theme(panel.grid.major = element_blank(),
        panel.grid.minor = element_blank(),
        axis.ticks.y = element_blank(),
        axis.ticks.x = element_blank())+
  theme(axis.text.x = element_text(colour = 'white',size = 0),
        axis.text.y = element_text(colour = 'white',size = 0))

test<-data.frame(test='Sepal.Width',size=1000)
text1<-ggplot(test,aes(x=test,y=1,label=test))+theme_bw()+xlab('')+ylab('') + xlab('')+ylab('')+geom_fit_text(grow=T)+
  theme(panel.grid.major = element_blank(),
        panel.grid.minor = element_blank(),
        axis.ticks.y = element_blank(),
        axis.ticks.x = element_blank())+
  theme(axis.text.x = element_text(colour = 'white',size = 0),
        axis.text.y = element_text(colour = 'white',size = 0))

test<-data.frame(test='Petal.Length',size=1000)
text2<-ggplot(test,aes(x=test,y=1,label=test))+theme_bw()+xlab('')+ylab('') + xlab('')+ylab('') +geom_fit_text(grow=T)+
  theme(panel.grid.major = element_blank(),
        panel.grid.minor = element_blank(),
        axis.ticks.y = element_blank(),
        axis.ticks.x = element_blank())+
  theme(axis.text.x = element_text(colour = 'white',size = 0),
        axis.text.y = element_text(colour = 'white',size = 0))

test<-data.frame(test='Petal.Width',size=1000)
text3<-ggplot(test,aes(x=test,y=1,label=test))+theme_bw()+xlab('')+ylab('') + xlab('')+ylab('') +geom_fit_text(grow=T)+
  theme(panel.grid.major = element_blank(),
        panel.grid.minor = element_blank(),
        axis.ticks.y = element_blank(),
        axis.ticks.x = element_blank())+
  theme(axis.text.x = element_text(colour = 'white',size = 0),
        axis.text.y = element_text(colour = 'white',size = 0))

p1=ggplot(data=iris)+aes(x=Sepal.Length,y=Sepal.Width,col=Species)+geom_point()+theme_bw()+theme(legend.position = 'none')+
  xlab('')+
  theme(axis.ticks.x = element_blank(),axis.text.x = element_blank())+
  scale_y_continuous(position = 'right')
p2=ggplot(data=iris)+aes(x=Sepal.Length,y=Petal.Length,col=Species)+geom_point()+theme_bw()+theme(legend.position = 'none')+
  xlab('')+
  theme(axis.ticks.x = element_blank(),axis.text.x = element_blank())+
  scale_y_continuous(position = 'right')
p3=ggplot(data=iris)+aes(x=Sepal.Length,y=Petal.Width,col=Species)+geom_point()+theme_bw()+theme(legend.position = 'none')+
  scale_y_continuous(position = 'right')
p4=ggplot(data=iris)+aes(x=Sepal.Width,y=Petal.Length,col=Species)+geom_point()+theme_bw()+theme(legend.position = 'none')+
  ylab('')+xlab('')+
  theme(axis.text.y = element_blank(),axis.ticks.y = element_blank(),
        axis.text.x = element_blank(),axis.ticks.x = element_blank())
p5=ggplot(data=iris)+aes(x=Sepal.Width,y=Petal.Width,col=Species)+geom_point()+theme_bw()+theme(legend.position = 'none')+
  ylab('')+
  theme(axis.text.y = element_blank(),
        axis.ticks.y = element_blank())
p6=ggplot(data=iris)+aes(x=Petal.Length,y=Petal.Width,col=Species)+geom_point()+theme_bw()+theme(legend.position = 'none')+
  ylab('')+
  theme(axis.text.y = element_blank(),
        axis.ticks.y = element_blank())

plot_mat=rbind(c(NA,NA,NA,1),
               c(NA,NA,2,3),
               c(NA,4,5,6),
               c(7,8,9,10))
grid.arrange(text, # 1= text
             text1,p1, # 2=text1, 3=p1
             text2,p4,p2, # 4=text2, 5=p4, 6=p2
             text3,p6,p5,p3, # 7=text3,8=p6, 9=p5 10=p3
             layout_matrix=plot_mat)
1번째 plot의 경우 scale_y_continuous를 이용하면 어느 정도 맞출 수 있을 것 같고,
6번째 plot의 경우 뭔가 y축의 tick 크기가 맞지 않아 조금 틀어진것 같습니다.
조금 수정을 하면 다음과 같은 결과를 얻을 수 있습니다.
1번째 변경
test<-data.frame(test='Sepal.Length',size=1000)
text<-ggplot(test,aes(x=test,y=1,label=test))+theme_bw()+ xlab('')+ylab('') + xlab('')+ylab('')+geom_fit_text(grow=T)+
  theme(panel.grid.major = element_blank(),
        panel.grid.minor = element_blank(),
        axis.ticks.y = element_blank(),
        axis.ticks.x = element_blank())+
  theme(axis.text.x = element_text(colour = 'white',size = 0),
        axis.text.y = element_text(colour = 'white',size = 0))


test<-data.frame(test='Sepal.Length',size=1000)
text<-ggplot(test,aes(x=test,y=1,label=test))+theme_bw()+ xlab('')+ylab('') + xlab('')+ylab('')+geom_fit_text(grow=T)+
  theme(panel.grid.major = element_blank(),
        panel.grid.minor = element_blank(),
        axis.ticks.y = element_blank(),
        axis.ticks.x = element_blank())+
  theme(axis.text.x = element_text(colour = 'white',size = 0),
        axis.text.y = element_text(colour = 'white',size = 0))+
  scale_y_continuous(position = 'right')
6번째 변경
변경 전
p2=ggplot(data=iris)+aes(x=Sepal.Length,y=Petal.Length,col=Species)+geom_point()+theme_bw()+theme(legend.position = 'none')+
  xlab('')+
  theme(axis.ticks.x = element_blank(),axis.text.x = element_blank())+
  scale_y_continuous(position = 'right')

  # 변경 후
p2=ggplot(data=iris)+aes(x=Sepal.Length,y=Petal.Length,col=Species)+geom_point()+theme_bw()+theme(legend.position = 'none')+
  xlab('')+
  theme(axis.ticks.x = element_blank(),axis.text.x = element_blank())+
  theme(plot.margin = unit(c(5.5,12.5,5.5,5.5),'pt'))+
  scale_y_continuous(position = 'right')
# ggplot기본 margin은 unit(c(5.5,5.5,5.5,5.5),'pt')이다. (상,우,하,좌 순서)

'실용적인프로그래밍 > R' 카테고리의 다른 글
| [R] 변이 위치 표시해보기! (0) | 2020.09.14 |
|---|---|
| [R] ggplot2 - Scatter plot (0) | 2020.07.22 |
| [R] ggplot2 package 기초 (qplot, ggplot) (0) | 2020.07.20 |
| [R] Machine learning (3) - Support vector machine (SVR, part2) (2) | 2020.07.10 |
| [R] Machine learning (2) - Support vector machine (SVM, part 1) (5) | 2020.07.09 |


댓글