오늘은 ggplot에서 중요한 부분만 골라서 설명드리도록 하겠습니다.
scatter plot기준으로 설명드리는 것이니 추후에는 다른 plot에 대해서도 포스팅하도록하겠습니다.
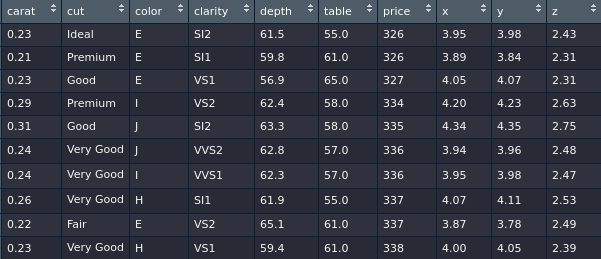
먼저 plot을 그리기 전에 데이터를 확인해보겠습니다.
summary(diamonds)
str(diamonds)
View(diamonds)
> summary(diamonds)
carat cut color clarity depth table price x
Min. :0.2000 Fair : 1610 D: 6775 SI1 :13065 Min. :43.00 Min. :43.00 Min. : 326 Min. : 0.000
1st Qu.:0.4000 Good : 4906 E: 9797 VS2 :12258 1st Qu.:61.00 1st Qu.:56.00 1st Qu.: 950 1st Qu.: 4.710
Median :0.7000 Very Good:12082 F: 9542 SI2 : 9194 Median :61.80 Median :57.00 Median : 2401 Median : 5.700
Mean :0.7979 Premium :13791 G:11292 VS1 : 8171 Mean :61.75 Mean :57.46 Mean : 3933 Mean : 5.731
3rd Qu.:1.0400 Ideal :21551 H: 8304 VVS2 : 5066 3rd Qu.:62.50 3rd Qu.:59.00 3rd Qu.: 5324 3rd Qu.: 6.540
Max. :5.0100 I: 5422 VVS1 : 3655 Max. :79.00 Max. :95.00 Max. :18823 Max. :10.740
J: 2808 (Other): 2531
y z
Min. : 0.000 Min. : 0.000
1st Qu.: 4.720 1st Qu.: 2.910
Median : 5.710 Median : 3.530
Mean : 5.735 Mean : 3.539
3rd Qu.: 6.540 3rd Qu.: 4.040
Max. :58.900 Max. :31.800
> str(diamonds)
tibble [53,940 × 10] (S3: tbl_df/tbl/data.frame)
$ carat : num [1:53940] 0.23 0.21 0.23 0.29 0.31 0.24 0.24 0.26 0.22 0.23 ...
$ cut : Ord.factor w/ 5 levels "Fair"<"Good"<..: 5 4 2 4 2 3 3 3 1 3 ...
$ color : Ord.factor w/ 7 levels "D"<"E"<"F"<"G"<..: 2 2 2 6 7 7 6 5 2 5 ...
$ clarity: Ord.factor w/ 8 levels "I1"<"SI2"<"SI1"<..: 2 3 5 4 2 6 7 3 4 5 ...
$ depth : num [1:53940] 61.5 59.8 56.9 62.4 63.3 62.8 62.3 61.9 65.1 59.4 ...
$ table : num [1:53940] 55 61 65 58 58 57 57 55 61 61 ...
$ price : int [1:53940] 326 326 327 334 335 336 336 337 337 338 ...
$ x : num [1:53940] 3.95 3.89 4.05 4.2 4.34 3.94 3.95 4.07 3.87 4 ...
$ y : num [1:53940] 3.98 3.84 4.07 4.23 4.35 3.96 3.98 4.11 3.78 4.05 ...
$ z : num [1:53940] 2.43 2.31 2.31 2.63 2.75 2.48 2.47 2.53 2.49 2.39 ...summary나 str을 보시면 각 column들이 어떤 형태를 갖는지 확인할 수가 있습니다.
기본적인 scatter plot 기능
library(ggplot2)
library(gridExtra)
data("diamonds")

# 기본적인 scatter plot
p1=ggplot(data=diamonds)+aes(x=price, y=carat)+geom_point()+labs(tag = 'A',title = 'Basic scatter plot')+
  theme(plot.title =  element_text(hjust = 0.5, size=7))# plot.tag = element_text(margin =  margin(2,2,2,2,'cm'))

# point에 색추가
p2=ggplot(data=diamonds)+aes(x=price,y=carat,col=cut)+geom_point()+labs(tag = 'B',title = 'Basic scatter plot plus color')+
  theme(plot.title = element_text(size=7))

# point size에다 추가 변수값 넣기
p3=ggplot(data=diamonds)+aes(x=price,y=carat,size=depth)+geom_point()+labs(tag = 'C',title = 'Basic scatter plot plus point size')+
  theme(plot.title = element_text(size=7))

# point에 투명도 적용
p4=ggplot(data=diamonds)+aes(x=price,y=carat)+geom_point(alpha=0.1)+labs(tag = 'D',title = 'Basic scatter plot plus alpha')+
  theme(plot.title = element_text(size=7))

# point에 투명도 적용과 색 지정
p5=ggplot(data=diamonds)+aes(x=price,y=carat)+geom_point(alpha=0.1,color='orange')+labs(tag = 'E',title = 'Basic scatter plot plus alpha, color')+
  theme(plot.title = element_text(size=7))

# ggplot에서는 뒤에 명령어에 따라 결과가 결정됨.
p6=ggplot(data=diamonds)+aes(x=price,y=carat,col=carat)+geom_point(alpha=0.1,color='orange')+labs(tag = 'F',title = 'Basic scatter plot plus color, point size, color')+
  theme(plot.title = element_text(size=7))

# legend key 변수이름 변경
p7=ggplot(data=diamonds)+aes(x=price,y=carat,col=clarity)+geom_point(alpha=0.1)+labs(tag = 'G',title = 'Basic scatter plot plus change legend key')+
  theme(plot.title = element_text(size=7))+scale_colour_discrete(labels=c('Step1','Step2','Step3','Step4','Step5','Step6','Step7','Step8'))

# legend key 변수 지정 색 변경
p8=ggplot(data=diamonds)+aes(x=price,y=carat,col=clarity)+geom_point()+labs(tag = 'H',title = 'Basic scatter plot plus change legend key, color')+
  theme(plot.title = element_text(size=7))+scale_colour_discrete(labels=c('Step1','Step2','Step3','Step4','Step5','Step6','Step7','Step8'))+scale_colour_manual(name="Step",values = c(1,2,3,4,5,6,7,8))

grid.arrange(p1,p2,p3,p4,p5,p6,p7,p8,ncol=3)

A (p1) - 기본적인 scatter plot입니다.
B (p2) - aes() 내부에 col 혹은 colour로 diamonds의 cut와 같은 factor나 character로 들어가게되면, 각 factor, character 종류 별로 색이 붙게 됩니다.
C (p3) - aes() 내부에 size라는 함수를 이용하면, 3개의 변수(연속된 숫자로 되어있을 경우)를 이용한 값을 확인할 수가 있습니다.
D (p4) - geom_points에 alpha라는 함수를 추가하여 point들의 투명도를 변경할 수가 있습니다.
E (p5) - geom_points에 color라는 함수를 추가하여 point들의 값들을 지정할 수가 있습니다.
F (p6) - aes에서 먼저 color함수를 지정하였더라도 geom_point의 color값을 우선시 합니다.
G (p7) - scale_colour_discrete()안에 있는 label을 이용하여 legend안에 있는 key를 변경할 수가 있습니다.
H (p8) - scale_colour_manual()안에 있는 name, values를 이용하여 legend name과 색을 지정할 수가 있습니다.
Point Color 변경
library(ggplot2)
library(gridExtra)
data("diamonds")

# 연속적인 값들을 이용한 point 색 변경
p1=ggplot(data=diamonds)+aes(x=price,y=carat,col=depth)+geom_point()+
labs(tag = 'A',title = 'Basic scatter plot plus continuous point value')

# points 모양 변경
p2=ggplot(data=diamonds)+aes(x=price,y=carat,shape=clarity)+geom_point(alpha=0.5)+
labs(tag = 'B',title = 'Basic scatter plot plus shape')

# points 테두리 변경
p3=ggplot(data=diamonds)+aes(x=price,y=carat,size=depth)+
geom_point(shape=21,colour='black',fill='red',size=3,stroke=2)+
labs(tag = 'C',title = 'Basic scatter plot plus points borders')

# point 색 지정
p4=ggplot(data=diamonds)+aes(x=price,y=carat,col=clarity)+geom_point()+
scale_color_manual(values=c('red','blue','orange','yellow','#999999','#999342','#E69F00','#56B4E9'))+
  labs(tag = 'D',title = 'Basic scatter plot plus points color')

grid.arrange(p1,p2,p3,p4,ncol=2)
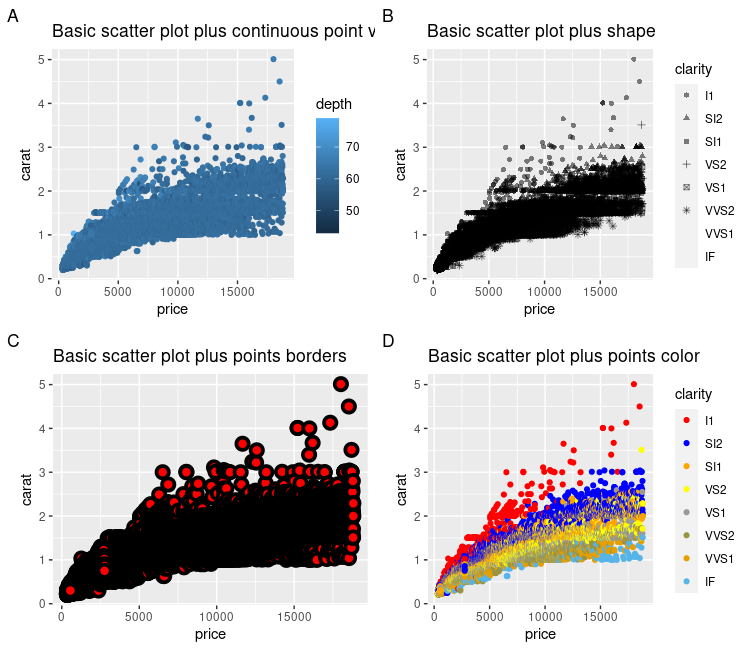
A (p1) - continuous values들을 point색으로 지정이 가능합니다.
B (p2) - points들의 모양을 aes안에 shape기능을 이용하여 변경할 수 있습니다. Point별 색을 넣는 것처럼 동일하게 종류별 모양이 가능합니다.
C (p3) - points의 모양을 조금 커스텀할 수가 있습니다. geom_point안에 colour와 fill, size, stroke를 이용하여 마음대로 변경이 가능합니다.
D (p4) -points의 색을 각각 조절할수가 있습니다. (색 이름으로 가능('red', 'blue'같은)하고, RGB코드로도 가능합니다.)
RGB코드는 모든 색을 6자리값으로 지정하는 코드이고, 다음과 같은 사이트에서 확인이 가능합니다.
www.rapidtables.com/web/color/RGB_Color.html
RGB Color Codes Chart 🎨
RGB Color Codes Chart RGB color picker | RGB color codes chart | RGB color space | RGB color format and calculation | RGB color table RGB color picker RGB color codes chart Hover with cursor on color to get the hex and decimal color codes below: RGB color
www.rapidtables.com
Scatter plot에서 line 그리기
data("iris")

# regression line을 type마다 설정
p1=ggplot(data=iris)+aes(x=Sepal.Length,y=Petal.Length,col=Species)+geom_point()+
geom_smooth()+labs(tag = 'A',title = 'Basic scatter plot plus regression line')+
  theme(title = element_text(size=8))

# 선과 선을 연결하는 line 설정
p2=ggplot(data=iris)+aes(x=Sepal.Length,y=Petal.Length,col=Species)+geom_point()+
geom_line()+labs(tag = 'B',title = 'Basic scatter plot plus line')+
  theme(title = element_text(size=8))

# linear model적용시킨 선 설정
p3=ggplot(data=iris)+aes(x=Sepal.Length,y=Petal.Length)+geom_point(alpha=0.1)+
geom_smooth(method = 'lm',se=F)+
labs(tag = 'C',title = 'Basic scatter plot plus Linear Regression Model (lm)')+
  theme(title = element_text(size=6.5))

# Generalized Linear model 적용시킨 선 설정
p4=ggplot(data=iris)+aes(x=Sepal.Length,y=Petal.Length)+geom_point(alpha=0.1)+
geom_smooth(method = 'glm',se=F)+
labs(tag = 'D',title = 'Basic scatter plot plus Generalized Linear Model (glm)')+
  theme(title = element_text(size=6.5))

# generalized additive model 적용시킨 선 설정
p5=ggplot(data=iris)+aes(x=Sepal.Length,y=Petal.Length)+geom_point(alpha=0.1)+
geom_smooth(method = 'gam',se=F)+
labs(tag = 'E',title = 'Basic scatter plot plus generalized additive Model (gam)')+
  theme(title = element_text(size=6.5))

# Loess Regression model 적용시킨 선 설정
p6=ggplot(data=iris)+aes(x=Sepal.Length,y=Petal.Length)+geom_point(alpha=0.1)+
geom_smooth(method = 'loess',se=F)+
labs(tag = 'F',title = 'Basic scatter plot plus Loess Regression Model (loess)')+
  theme(title = element_text(size=6.5))

# line color
p7=ggplot(data=iris)+aes(x=Sepal.Length,y=Petal.Length,col=Species)+geom_point()+
scale_color_brewer(palette='Spectral')+geom_smooth()+labs(tag = 'G',title = 'Basic scatter plot plus continuous point value')+
  theme(title = element_text(size=8))

# line color,type
p8=ggplot(data=iris)+aes(x=Sepal.Length,y=Petal.Length,col=Species,linetype=Species)+geom_point()+
scale_linetype_discrete(name='test')+geom_smooth()+labs(tag = 'H',title = 'Basic scatter plot plus continuous point value')+
  theme(title = element_text(size=8),legend.key.height = unit(0.1,'cm'),legend.margin = margin(0,.1,0,.1,'cm'))

grid.arrange(p1,p2,p3,p4,p5,p6,p7,p8,ncol=3)
A (p1) -ggplot에서 기본적으로 선을 긋는 방법인 geom_smooth() 기본 regression 선을 그려주고 default로 loess regression선을 그어준다. (se=F를 해주면 신뢰구간 삭제가능)
B (p2) - ggplot에서 점과 점을 그어주는 geom_line() 순서대로 점과 점을 그어준다.
C (p3) - geom_smooth()을 이용하여 Linear Regression Model 선을 그어준다.
D (p4) - geom_smooth()을 이용하여 Generalized Linear Model선을 그어준다.
E (p5) - geom_smooth()을 이용하여 Generalized additive Model 선을 그어준다.
F (p6) - geom_smooth()을 이용하여 Loess Regression Model 선을 그어준다. (더 굴곡진 선)
G (p7) - scale_color_brewer()을 이용하여 선과 점의 색을 조절할 수가 있다..
H (p8) - scale_colour_manual()안에 있는 name, values를 이용하여 legend name과 색을 지정할 수가 있습니다.
legend 조절
data("iris")

# legend 안으로 넣기
p1=ggplot(data=iris)+aes(x=Sepal.Length,y=Petal.Length,colour=Species)+geom_point()+
  theme(legend.direction = 'horizontal',legend.position = c(.5,.05))+
  labs(tag = 'A',title = 'Basic scatter plot plus inside legend')

# legend 위치 조절
p2=ggplot(data=iris)+aes(x=Sepal.Length,y=Petal.Length,colour=Species)+geom_point()+
  theme(legend.direction = 'horizontal',legend.position = 'top')+
  labs(tag = 'B',title = 'Basic scatter plot plus top position legend')

# legend 삭제
p3=ggplot(data=iris)+aes(x=Sepal.Length,y=Petal.Length,colour=Species)+geom_point()+
  theme(legend.position = 'none')+labs(tag = 'C',title = 'Basic scatter plot plus none legend')

# legend 이름, 제목 조절
p4=ggplot(data=iris)+aes(x=Sepal.Length,y=Petal.Length,colour=Species)+geom_point()+
  scale_colour_discrete(name='test',labels=c('species1','species2','species3'))+
  labs(tag = 'D',title = 'Basic scatter plot plus change legend text')

# legend 색 조절
p5=ggplot(data=iris)+aes(x=Sepal.Length,y=Petal.Length,colour=Species)+geom_point()+
  scale_colour_discrete()+theme(legend.background = element_rect(fill='yellow'),legend.key=element_rect(fill='white',color='black'))+
  labs(tag = 'E',title = 'Basic scatter plot plus legend color')

# 여러가지 legend 추가
p6=ggplot(data=diamonds)+aes(x=price,y=carat)+geom_point(aes(color=clarity,size=depth,shape=cut))+
  labs(tag = 'F',title = 'Basic scatter plot plus Multiple legend')+theme(legend.position = 'bottom',legend.box = 'vertical')+
  theme(legend.margin = margin(0,.1,0,.1,'cm'),legend.key.height = unit(0.01,'cm'))

grid.arrange(p1,p2,p3,p4,p5,p6,ncol=2)
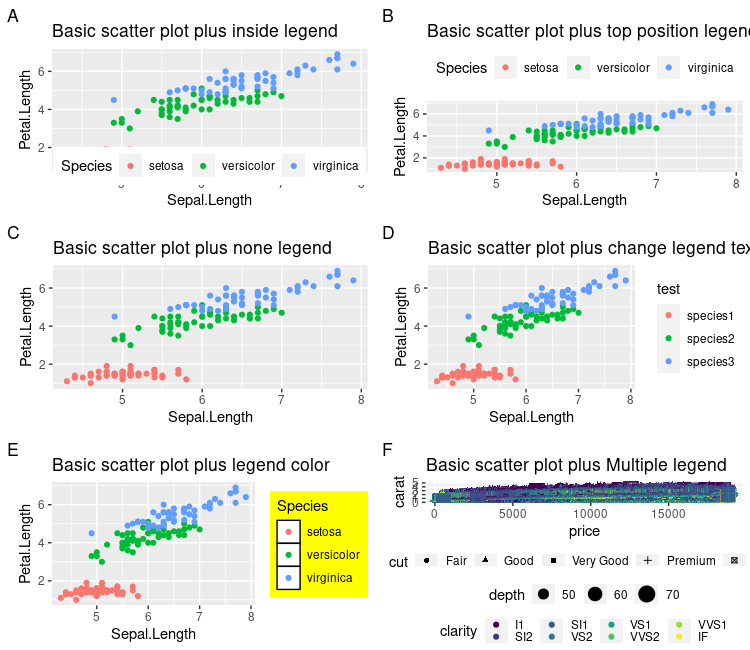
A, F가 잘 안보이므로 따로 뺴서 보면 다음과 같다.
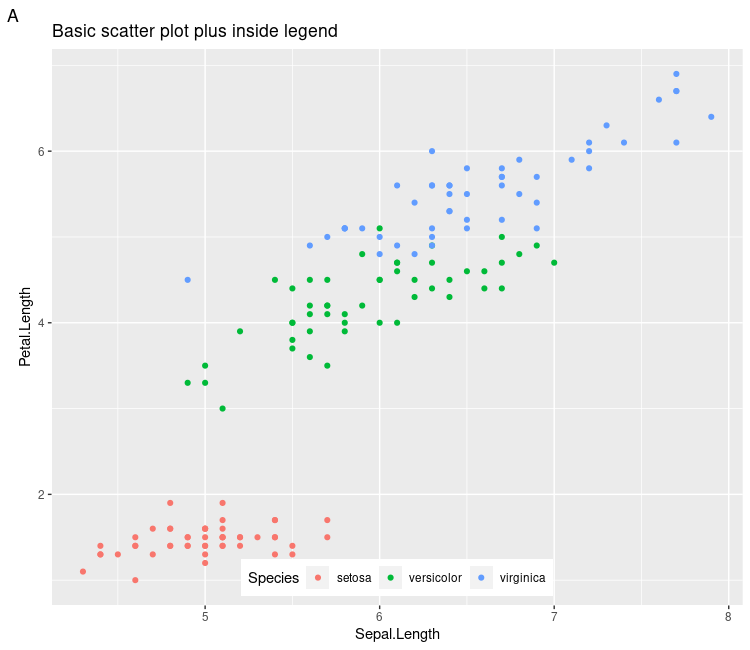

A (p1) - legend 위치를 조절하고 싶을경우 theme()에서 legend.direction(), legend.position()을 조절해주면 된다.
B (p2) - A 설명과 같이 위치를 방향 이름으로도 써서 조절이 가능하다 ('top', 'bottom', 'right', 'left')
C (p3) - legend를 제거 시키는 방법
D (p4) -legend에서 scale_colour_discrete()라는 기능을 이용하여 name, labels을 이용하여 제목과 이름을 변경할수가있다.
E (p5) - theme의 legend.key와 legend.background를 element_rect()로 이용하여 legend color를 customize 할수가 있다.
F (p6) - aes()설정을 통하여 여러 legend를 추가사용할 수 있다. (크기조절을 필수다)
theme조절
마지막으로 가장 중요한 theme 변경입니다.
논문이나, 보고서나 항상 이쁜 그래프가 필요합니다. 그렇기 때문에 theme도 중요한 요소중 하나입니다.
package에 ggthemes라는 곳에서는 다양한 theme를 제공합니다.
library(ggthemes)

p1=ggplot(data=iris)+aes(x=Sepal.Length,y=Petal.Length,colour=Species)+geom_point()+
  labs(tag = 'A',title = 'Basic scatter plot (basic theme)')

p2=ggplot(data=iris)+aes(x=Sepal.Length,y=Petal.Length,colour=Species)+geom_point()+
  labs(tag = 'B',title = 'Basic scatter plot (basic theme bw)')+theme_bw()

p3=ggplot(data=iris)+aes(x=Sepal.Length,y=Petal.Length,colour=Species)+geom_point()+
  labs(tag = 'C',title = 'Basic scatter plot (basic theme classic)')+theme_classic()

p4=ggplot(data=iris)+aes(x=Sepal.Length,y=Petal.Length,colour=Species)+geom_point()+
  labs(tag = 'D',title = 'Basic scatter plot (basic theme dark)')+theme_dark()

p5=ggplot(data=iris)+aes(x=Sepal.Length,y=Petal.Length,colour=Species)+geom_point()+
  labs(tag = 'E',title = 'Basic scatter plot (basic theme linedraw)')+theme_linedraw()

p6=ggplot(data=iris)+aes(x=Sepal.Length,y=Petal.Length,colour=Species)+geom_point()+
  labs(tag = 'F',title = 'Basic scatter plot (basic theme void)')+theme_void()

grid.arrange(p1,p2,p3,p4,p5,p6,ncol=2)

p1=ggplot(data=iris)+aes(x=Sepal.Length,y=Petal.Length,colour=Species)+geom_point()+
  labs(tag = 'G',title = 'Basic scatter plot (basic theme clean)')+theme_clean()

p2=ggplot(data=iris)+aes(x=Sepal.Length,y=Petal.Length,colour=Species)+geom_point()+
  labs(tag = 'H',title = 'Basic scatter plot (basic theme hc)')+theme_hc()

p3=ggplot(data=iris)+aes(x=Sepal.Length,y=Petal.Length,colour=Species)+geom_point()+
  labs(tag = 'I',title = 'Basic scatter plot (basic theme wsj)')+theme_wsj()

p4=ggplot(data=iris)+aes(x=Sepal.Length,y=Petal.Length,colour=Species)+geom_point()+
  labs(tag = 'J',title = 'Basic scatter plot (basic theme gdocs)')+theme_gdocs()

grid.arrange(p1,p2,p3,p4,ncol=2)

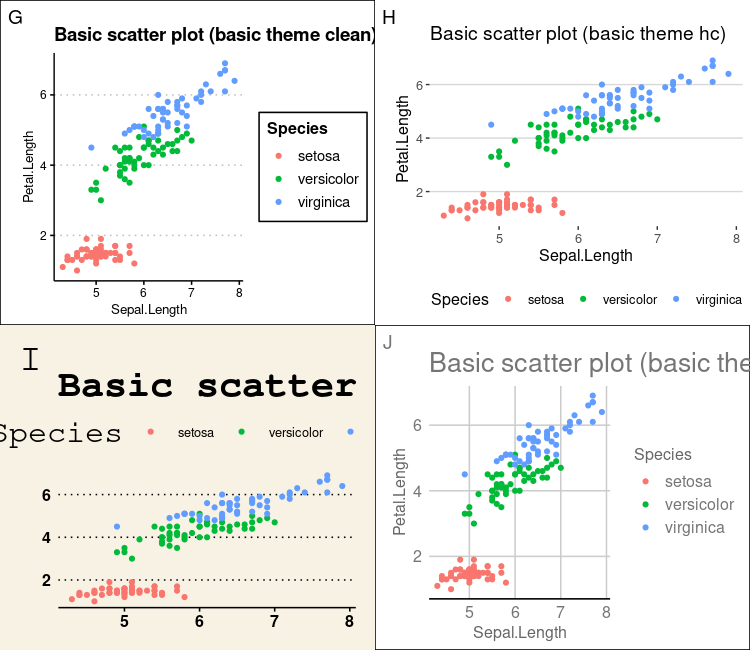
제가 논문에 주로 사용하는 theme는 theme_bw(), theme_linedraw()입니다.
Default는 너무 예쁘지가 않습니다.! ㅎㅎㅎ
theme_linedraw()가 theme_bw()에 비해 좀더 진한 선을 갖는 것이 특징입니다.
여기까지 ggplot의 기본적인 것들을 배워 보았습니다.
양이 적은줄 알았는데 막상 포스팅하니 시간이 꽤 걸렸네요. ㅎㅎ
유용하셨거나, 잘 보셧다면 주변 광고 한번씩만 클릭 부탁드립니다! 감사합니다!
'실용적인프로그래밍 > R' 카테고리의 다른 글
| [R] KEGGREST package (0) | 2020.10.06 |
|---|---|
| [R] 변이 위치 표시해보기! (0) | 2020.09.14 |
| [R] ggplot - pair plot 그려보기 (ggplot 기초, gridExtra, ggfittext) (0) | 2020.07.21 |
| [R] ggplot2 package 기초 (qplot, ggplot) (0) | 2020.07.20 |
| [R] Machine learning (3) - Support vector machine (SVR, part2) (2) | 2020.07.10 |


댓글